
This post was originally posted on the blog Cato at Liberty and is reproduced here with the author’s permission.
A common criticism of immigration reform (here, here, and here) is that it will decrease economic freedom in the United States, by increasing the voting pool for the Democratic Party. Leaving aside the issue of which party supports economic liberty, if any, it’s important to see what the actual impacts of immigration are on economic freedom in the United States and the world. The political effects of immigrants after they arrive are less certain than the economic benefits. Do immigrants decrease economic freedom in their new countries? The bottom line: fears of immigrants decreasing economic freedom seem unfounded.
Since 1980, wealthy countries have seen rises in immigrant populations. Immigrants are drawn to economic prosperity, higher wages, and better standards of living so it’s not surprising that wealthier countries have higher percentages of immigrants. I excluded numerous small countries and petro-states like the UAE and Kuwait from the analysis.
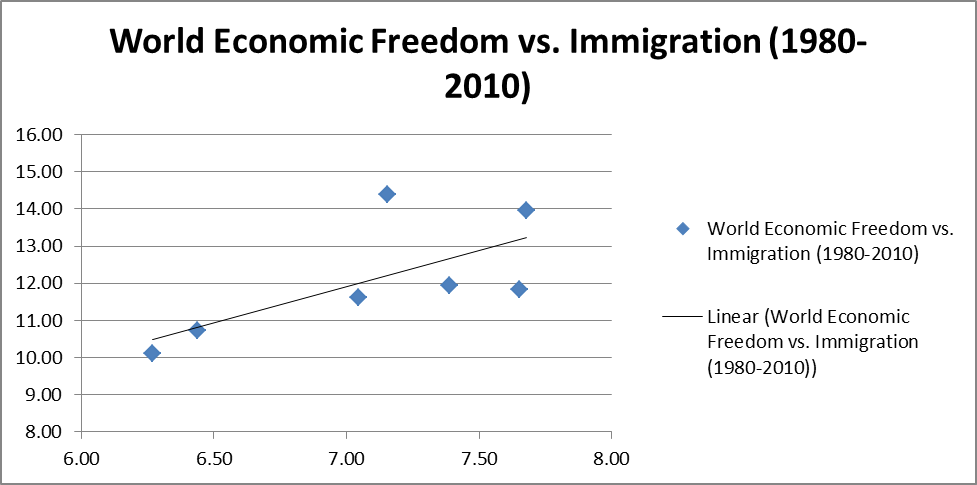
I looked at the 25 wealthiest nations in the world in 1980 (by per capita GDP PPP) and considered their economic freedom rating and the percent foreign born. I then tracked those same countries every 5 years until 2010. Here are the averages for all 25 nations:
|
World |
|||
|
Year |
Economic Freedom Rating |
GDP Per Capita (PPP) |
Immigrant (%) |
|
1980 |
6.27 |
$20,875 |
10.11 |
|
1985 |
6.44 |
$21,475 |
10.72 |
|
1990 |
7.05 |
$23,912 |
11.61 |
|
1995 |
7.39 |
$24,671 |
11.95 |
|
2000 |
7.65 |
$28,788 |
11.82 |
|
2005 |
7.68 |
$30,454 |
13.96 |
|
2010 |
7.15 |
$30,481 |
14.37 |
Sources: Economic Freedom of the World: 2012 Annual Report, World Bank Development Indicators
From 1980 to 2010, the average economic freedom rating for those 25 nations increased by .88 points and their foreign born populations increased by 4.27 percentage points, while per capita GDP increased by $9,606. The Great Recession makes those numbers appear less remarkable because of the decrease in economic freedom between 2005 and 2010 that accompanied the slowdown in growth.
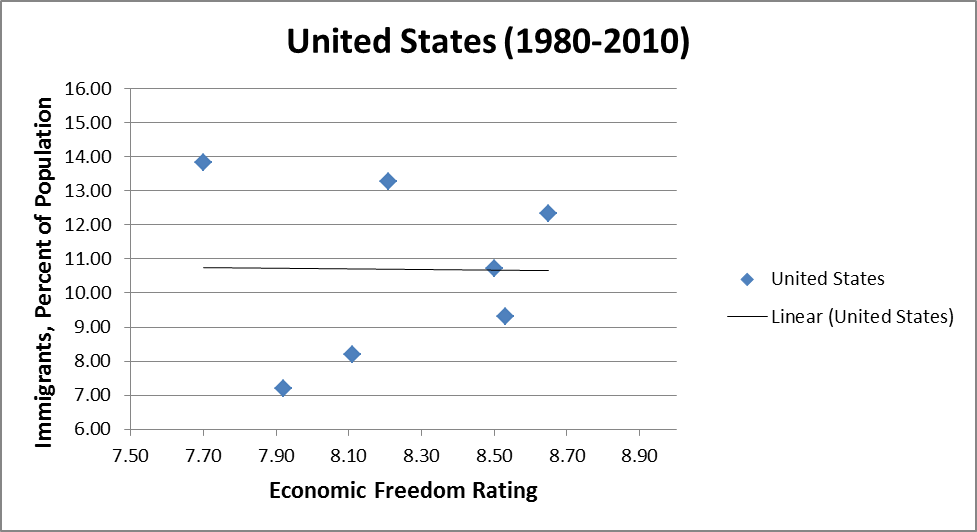
And when we zoom in on the United States:
|
United States |
|||
|
Year |
Economic Freedom Rating |
GDP Per Capita (PPP) |
Immigrant (%) |
|
1980 |
7.92 |
$25,510 |
7.20 |
|
1985 |
8.11 |
$28,562 |
8.19 |
|
1990 |
8.53 |
$31,899 |
9.31 |
|
1995 |
8.50 |
$33,874 |
10.71 |
|
2000 |
8.65 |
$39,545 |
12.34 |
|
2005 |
8.21 |
$42,516 |
13.29 |
|
2010 |
7.70 |
$42,079 |
13.84 |
Sources: Economic Freedom of the World: 2012 Annual Report, World Bank Development Indicators
From 1980-2010, the United States’ economic freedom rating fell by .22 and the foreign-born population increased by 6.64 percentage points. The entire loss in economic freedom occurred post 2005 while the foreign-born population rose by .55 of a percentage point, the smallest increase in any 5-year period. It seems highly unlikely that a .55 percentage point increase crossed a threshold that caused the economic freedom rating to decrease so much.
Remember that the claim made by many opponents of immigration reform is that more immigrants will cause a decrease in economic freedom. A linear regression (OLS) of the economic freedom rating and the percent of immigrants in the United States produced a coefficient of -0.0013908 with a t-value of -.02. The R-squared for that regression is 0.0001. That means that factors other than immigration explain 99.99 percent of the decrease in America’s economic freedom rating. On its face, the hypothesis that an increasing percentage of immigrants in the United States will decrease economic freedom does not hold much water.
Sources: Economic Freedom of the World: 2012 Annual Report, World Bank Development Indicators
Excluding small countries, here are the wealthiest nations in the world in 1980:
|
1980 |
||||
|
Richest Excluding Small Countries |
||||
|
GDP per capita, PPP |
Income | % Immigrant | EF Rating | |
|
1 |
Saudi Arabia |
33,903 |
19.60% |
– |
|
2 |
Switzerland |
29,363 |
16.90% |
7.99 |
|
3 |
Norway |
26,205 |
3.00% |
5.79 |
|
4 |
Bahamas |
26,045 |
11.40% |
6.26 |
|
5 |
United States |
25,510 |
7.20% |
7.92 |
|
6 |
Canada |
23,070 |
15.50% |
7.68 |
|
7 |
Netherlands |
22,271 |
3.50% |
7.23 |
|
8 |
Iceland |
21,847 |
2.50% |
5.25 |
|
9 |
Bahrain |
21,139 |
28.90% |
7.42 |
|
10 |
Belgium |
20,793 |
9.10% |
7.06 |
|
11 |
Denmark |
20,790 |
3.20% |
6.39 |
|
12 |
Austria |
20,714 |
9.50% |
6.33 |
|
13 |
Sweden |
20,362 |
7.50% |
5.68 |
|
14 |
France |
20,264 |
10.70% |
6.09 |
|
15 |
Australia |
19,784 |
19.70% |
6.86 |
|
16 |
Italy |
18,814 |
2.00% |
5.37 |
|
17 |
United Kingdom |
18,154 |
6.00% |
6.57 |
|
18 |
Finland |
17,858 |
0.80% |
6.65 |
|
19 |
Japan |
17,835 |
0.70% |
6.88 |
|
20 |
New Zealand |
17,391 |
15.10% |
6.35 |
|
21 |
Greece |
17,043 |
1.80% |
5.76 |
|
22 |
Gabon |
17,007 |
13.90% |
4.50 |
|
23 |
Spain |
15,368 |
1.60% |
6.10 |
|
24 |
Trinidad and Tobago |
15,310 |
5.70% |
4.83 |
|
25 |
Israel |
15,028 |
36.90% |
3.48 |
| Average |
20,875 |
10.11% |
6.27 |
|
Sources: World Bank, Cato Economic Freedom of the World Index.
In 1980, 9.4 percent of people living in all countries (including small ones like Monaco and the United Arab Emirates) were immigrants, compared to 10.1 percent in the richest countries. The average economic freedom rating in the world was 5.4 compared to 6.27 for the richest. In 1980, the 25 richest countries in the world had more immigrants and more economic freedom than the average nation.
|
2010 |
||||
|
Richest Excluding Small Countries |
||||
|
GDP per capita, PPP |
Income | % Immigrant | EF Rating | |
|
1 |
Norway |
46,906 |
10.00% |
7.53 |
|
2 |
United States |
42,079 |
13.50% |
7.70 |
|
3 |
Switzerland |
39,072 |
23.20% |
8.07 |
|
4 |
Netherlands |
36,925 |
10.50% |
7.58 |
|
5 |
Ireland |
35,993 |
19.60% |
7.92 |
|
6 |
Austria |
35,313 |
15.60% |
7.55 |
|
7 |
Canada |
35,223 |
21.30% |
8.09 |
|
8 |
Australia |
34,602 |
21.90% |
8.14 |
|
9 |
Sweden |
34,125 |
14.10% |
7.62 |
|
10 |
Germany |
33,565 |
13.10% |
7.53 |
|
11 |
Belgium |
32,882 |
9.10% |
7.47 |
|
12 |
United Kingdom |
32,814 |
10.40% |
7.87 |
|
13 |
Iceland |
32,779 |
11.30% |
7.02 |
|
14 |
Denmark |
32,379 |
8.80% |
7.76 |
|
15 |
Finland |
31,310 |
4.20% |
7.89 |
|
16 |
Japan |
30,965 |
1.70% |
7.61 |
|
17 |
Equatorial Guinea |
30,493 |
1.10% |
– |
|
18 |
France |
29,484 |
10.70% |
7.39 |
|
19 |
Italy |
27,083 |
7.40% |
6.73 |
|
20 |
Spain |
26,901 |
14.10% |
7.40 |
|
21 |
Korea |
26,774 |
1.10% |
7.20 |
|
22 |
Israel |
25,995 |
40.40% |
7.25 |
|
23 |
Slovenia |
25,053 |
8.10% |
6.62 |
|
24 |
Oman |
24,559 |
28.40% |
8.00 |
|
25 |
New Zealand |
24,400 |
22.00% |
8.38 |
| Average |
32,307 |
13.32% |
7.60 |
|
Sources: World Bank Development Indicators, Economic Freedom of the World: 2012 Annual Report.
In 2010, 11 percent of people living in all countries were immigrants. The average economic freedom rating in the world was 6.84, 1.44 points higher than in 1980. The 25 richest countries in 2010 had a greater percentage of immigrants and a higher economic freedom rating than the rest.
These results are not surprising. To the extent that economic freedom produces greater economic prosperity, immigration will likely increase. Given the results from the regression analysis, there is practically zero evidence that immigrants have caused a decline in economic freedom. Other factors, such as an increase in the regulated state, likely explain changes in economic freedom more than the intensity of immigration.
Opposing immigration reform for the reason that new immigrants will decrease economic freedom is a popular excuse in some circles – but there is surprisingly little evidence to support this myth. Moreover, merely pointing out that immigrants are more likely to vote for the Democratic Party is insufficient because actual policy shifts count more than partisan political outcomes. Those who claim immigrants will decrease economic freedom have yet to prove it.