Social conservatism and attitudes to immigration

A little while ago, I got into a debate with Vipul Naik over the link between social conservatism and open borders. My hypothesis was that social conservatives would oppose open borders because they are defending in-group privilege. Also, being socially conservative correlates with Republican party identification, which correlates with negative views of immigrants. In contrast, Vipul thought that the opposite might be true. Social conservative ideas (e.g., anti-abortion) do not logically entail anti-immigrant views. Immigration attitudes might be decoupled from social attitudes.

Here is what I found out when I used the General Social Survey to explore this issue. First, you have to identify an immigration question. The GSS has a few. The most general is “527. Do you think the number of immigrants from foreign countries who are permitted to come to the United States to live should be increased a lot, increased a little, left the same as it is now, decreased a little, or decreased a lot?” 1 – increased a lot. 5 – Decreased a lot. Roughly speaking, 8% increase, 37% stay the same, 54% decrease immigration.

Ok, let’s crank through some measures of social conservatism:

* Ideology: “66 A. We hear a lot of talk these days about liberals and conservatives. I’m going to show you a seven-point scale on which the political views that people might hold are arranged from extremely liberal–point 1–to extremely conservative– point 7. Where would you place yourself on this scale?” Correlation? .094 – p-value <.001. n=2598.
* Abortion attitudes: “251. Do you think abortions should be legal under any circumstances, legal only under certain circumstances, or never legal under any circumstance?” 1 – Always. 3 – Never. Correlation? .016, not significant. N=1497.
* Gay Rights: “219. What about sexual relations between two adults of the same sex–do you think it is always wrong, almost always wrong, wrong only sometimes, or not wrong at all?” 1- Always wrong, 4 – not wrong at all. Correlation? -.138, p <.001. N=1702.
* Affirmative action for blacks/women: “153/552. A. Some people say that because of past discrimination, blacks/women should be given preference in hiring and promotion. Others say that such preference in hiring and promotion of blacks is wrong because it discriminates against whites. What about your opinion — are you for or against preferential hiring and promotion of blacks?” 1. strong support to 4 strong oppose. Correlations? .198/.091 . p<.001/p =.07. N= 383 (each).
* Biblical literalism: “120A. Which of these statements comes closest to describing your feelings about the Bible? a. The Bible is the actual word of God and is to be taken literally, word for word. b. The Bible is the inspired word of God but not everything in it should be taken literally, word for word. c. The Bible is an ancient book of fables, legends, history, and moral precepts recorded by men.” 1 – word of God, 3 – book of fables. Correlation? .071, p=.16. N=383.

Bottom line: Anti-immigration views are always positively correlated with what we’d consider indicators of being socially conservative. In some cases, the correlation is strong, in other cases not significant. However, there are no cases where being conservative is correlated with having pro-immigration views.

Open Borders editorial note: You might also be interested in Nathan Smith’s post Who favors open borders?, that examines World Values Survey (WVS) data comparing attitudes to immigration in 48 countries around the world.

Immigration Does Not Decrease Economic Freedom

This post was originally posted on the blog Cato at Liberty and is reproduced here with the author’s permission.

A common criticism of immigration reform (herehere, and here) is that it will decrease economic freedom in the United States, by increasing the voting pool for the Democratic Party.  Leaving aside the issue of which party supports economic liberty, if any, it’s important to see what the actual impacts of immigration are on economic freedom in the United States and the world.  The political effects of immigrants after they arrive are less certain than the economic benefits.  Do immigrants decrease economic freedom in their new countries?  The bottom line: fears of immigrants decreasing economic freedom seem unfounded.

Since 1980, wealthy countries have seen rises in immigrant populations.  Immigrants are drawn to economic prosperity, higher wages, and better standards of living so it’s not surprising that wealthier countries have higher percentages of immigrants.  I excluded numerous small countries and petro-states like the UAE and Kuwait from the analysis.

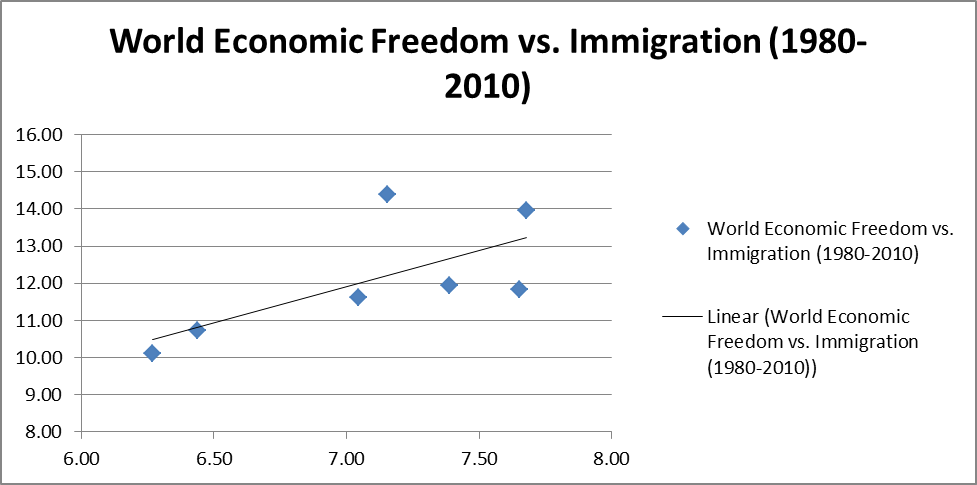
I looked at the 25 wealthiest nations in the world in 1980 (by per capita GDP PPP) and considered their economic freedom rating and the percent foreign born.  I then tracked those same countries every 5 years until 2010.  Here are the averages for all 25 nations:

World

Year

Economic Freedom Rating

GDP Per Capita (PPP)

Immigrant (%)

1980

6.27

$20,875

10.11

1985

6.44

$21,475

10.72

1990

7.05

$23,912

11.61

1995

7.39

$24,671

11.95

2000

7.65

$28,788

11.82

2005

7.68

$30,454

13.96

2010

7.15

$30,481

14.37

Sources: Economic Freedom of the World: 2012 Annual Report, World Bank Development Indicators

From 1980 to 2010, the average economic freedom rating for those 25 nations increased by .88 points and their foreign born populations increased by 4.27 percentage points, while per capita GDP increased by $9,606.  The Great Recession makes those numbers appear less remarkable because of the decrease in economic freedom between 2005 and 2010 that accompanied the slowdown in growth.

And when we zoom in on the United States:

United States

Year

Economic Freedom Rating

GDP Per Capita (PPP)

Immigrant (%)

1980

7.92

$25,510

7.20

1985

8.11

$28,562

8.19

1990

8.53

$31,899

9.31

1995

8.50

$33,874

10.71

2000

8.65

$39,545

12.34

2005

8.21

$42,516

13.29

2010

7.70

$42,079

13.84

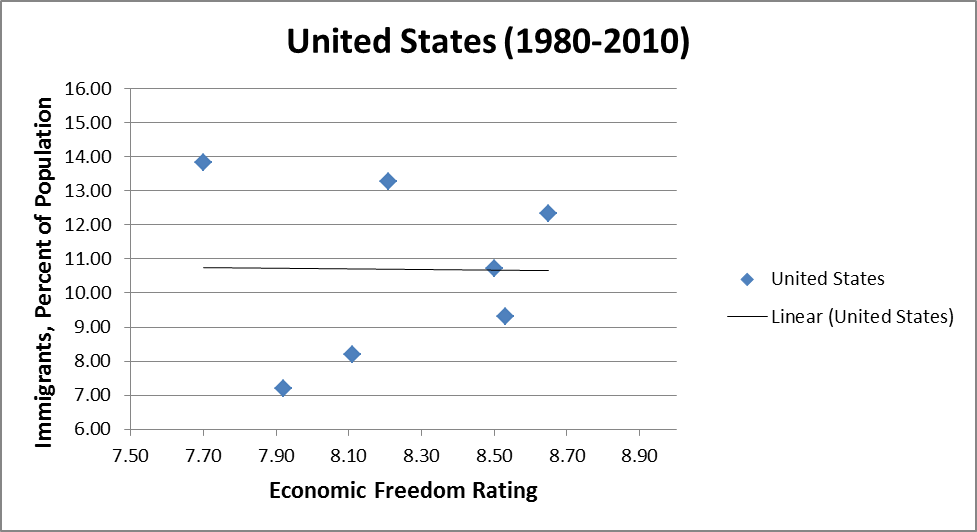
Sources: Economic Freedom of the World: 2012 Annual Report, World Bank Development Indicators

From 1980-2010, the United States’ economic freedom rating fell by .22 and the foreign-born population increased by 6.64 percentage points.  The entire loss in economic freedom occurred post 2005 while the foreign-born population rose by .55 of a percentage point, the smallest increase in any 5-year period.  It seems highly unlikely that a .55 percentage point increase crossed a threshold that caused the economic freedom rating to decrease so much.

Remember that the claim made by many opponents of immigration reform is that more immigrants will cause a decrease in economic freedom.  A linear regression (OLS) of the economic freedom rating and the percent of immigrants in the United States produced a coefficient of -0.0013908 with a t-value of -.02.  The R-squared for that regression is 0.0001.  That means that factors other than immigration explain 99.99 percent of the decrease in America’s economic freedom rating.  On its face, the hypothesis that an increasing percentage of immigrants in the United States will decrease economic freedom does not hold much water.

Sources: Economic Freedom of the World: 2012 Annual Report, World Bank Development Indicators

Excluding small countries, here are the wealthiest nations in the world in 1980:

1980

Richest Excluding Small Countries

GDP per capita, PPP

Income % Immigrant EF Rating

1

Saudi Arabia

33,903

19.60%

2

Switzerland

29,363

16.90%

7.99

3

Norway

26,205

3.00%

5.79

4

Bahamas

26,045

11.40%

6.26

5

United States

25,510

7.20%

7.92

6

Canada

23,070

15.50%

7.68

7

Netherlands

22,271

3.50%

7.23

8

Iceland

21,847

2.50%

5.25

9

Bahrain

21,139

28.90%

7.42

10

Belgium

20,793

9.10%

7.06

11

Denmark

20,790

3.20%

6.39

12

Austria

20,714

9.50%

6.33

13

Sweden

20,362

7.50%

5.68

14

France

20,264

10.70%

6.09

15

Australia

19,784

19.70%

6.86

16

Italy

18,814

2.00%

5.37

17

United Kingdom

18,154

6.00%

6.57

18

Finland

17,858

0.80%

6.65

19

Japan

17,835

0.70%

6.88

20

New Zealand

17,391

15.10%

6.35

21

Greece

17,043

1.80%

5.76

22

Gabon

17,007

13.90%

4.50

23

Spain

15,368

1.60%

6.10

24

Trinidad and Tobago

15,310

5.70%

4.83

25

Israel

15,028

36.90%

3.48

Average

20,875

10.11%

6.27

Sources: World BankCato Economic Freedom of the World Index.

In 1980, 9.4 percent of people living in all countries (including small ones like Monaco and the United Arab Emirates) were immigrants, compared to 10.1 percent in the richest countries.  The average economic freedom rating in the world was 5.4 compared to 6.27 for the richest.  In 1980, the 25 richest countries in the world had more immigrants and more economic freedom than the average nation.

2010

Richest Excluding Small Countries

GDP per capita, PPP

Income % Immigrant EF Rating

1

Norway

46,906

10.00%

7.53

2

United States

42,079

13.50%

7.70

3

Switzerland

39,072

23.20%

8.07

4

Netherlands

36,925

10.50%

7.58

5

Ireland

35,993

19.60%

7.92

6

Austria

35,313

15.60%

7.55

7

Canada

35,223

21.30%

8.09

8

Australia

34,602

21.90%

8.14

9

Sweden

34,125

14.10%

7.62

10

Germany

33,565

13.10%

7.53

11

Belgium

32,882

9.10%

7.47

12

United Kingdom

32,814

10.40%

7.87

13

Iceland

32,779

11.30%

7.02

14

Denmark

32,379

8.80%

7.76

15

Finland

31,310

4.20%

7.89

16

Japan

30,965

1.70%

7.61

17

Equatorial Guinea

30,493

1.10%

18

France

29,484

10.70%

7.39

19

Italy

27,083

7.40%

6.73

20

Spain

26,901

14.10%

7.40

21

Korea

26,774

1.10%

7.20

22

Israel

25,995

40.40%

7.25

23

Slovenia

25,053

8.10%

6.62

24

Oman

24,559

28.40%

8.00

25

New Zealand

24,400

22.00%

8.38

Average

32,307

13.32%

7.60

Sources: World Bank Development IndicatorsEconomic Freedom of the World: 2012 Annual Report.

In 2010, 11 percent of people living in all countries were immigrants.  The average economic freedom rating in the world was 6.84, 1.44 points higher than in 1980.  The 25 richest countries in 2010 had a greater percentage of immigrants and a higher economic freedom rating than the rest.

These results are not surprising.  To the extent that economic freedom produces greater economic prosperity, immigration will likely increase.  Given the results from the regression analysis, there is practically zero evidence that immigrants have caused a decline in economic freedom.  Other factors, such as an increase in the regulated state, likely explain changes in economic freedom more than the intensity of immigration.

Opposing immigration reform for the reason that new immigrants will decrease economic freedom is a popular excuse in some circles – but there is surprisingly little evidence to support this myth.  Moreover, merely pointing out that immigrants are more likely to vote for the Democratic Party is insufficient because actual policy shifts count more than partisan political outcomes.  Those who claim immigrants will decrease economic freedom have yet to prove it.

Land Of The Free

Post by John Roccia (occasional blogger for the site, joined April 2013). See:

Well, let’s just cut right to the chase. On Tuesday, July 2nd, a guest blogger with the handle “Land of the Free” kicked the proverbial hornet’s nest here at Open Borders with a post titled Betting The Republic, and promised to reveal his/her secret identity after a week of debate.

It’s me!

Before the rotten tomatoes start flying, however, let me explain a few things. First, the views expressed by Land of the Free (or LOTF, for short) are not my views. Not even a little. Take a look at my past work here on Open Borders, and you’ll see that I’m as vehemently pro-open-borders as they come. When I wrote the two posts and the various comments as LOTF I was, to put it mildly, lying through my teeth. I wrote deliberate falsehoods about my identity and past work in order to throw you off the scent, and then I created an entirely false – but hopefully plausible-sounding – argument to present to you.

Why did I do all of this? I had two main motivators. The primary reason was as a form of social experimentation that Professor Bryan Caplan calls an “Ideological Turing Test.” A brief explanation of an ITT is this: if you can present an argument that is opposed to your own, and present it well enough that people can’t tell that you don’t actually hold those beliefs, you can be said to have “passed an Ideological Turing Test.” If you can’t pass an ITT, then chances are good that you don’t actually understand your opponent’s arguments, and are relying on straw men, being uncharitable, living in an echo chamber, or any other metaphors for poor debate technique. As to whether I think I actually passed the ITT, I’ll discuss that below.

Before I do that, I want to talk briefly about my other motivator. As far as arguments against open borders go, the issue of political externalities is the one I consider to be the strongest. I don’t agree with it, but I certainly think it’s more difficult to argue against than things like welfare drain or job-stealing, which are far more easily refuted. So in presenting this argument specifically, I wanted to draw out the very best of the counter-arguments – and you didn’t disappoint!

Michael Carey, Peter Hurley, David Bennion, Hansjorg Walther, (especially) Nathan Smith and several others presented excellent arguments – so excellent, in fact, that at a certain point I was actually unable to continue arguing the point. Some of my points were easier to refute than others (in fact, several of the points I made as part of my larger argument, such as the mention of IQ and the precautionary principle, I made to obscure my identity and leave false clues, rather than because they were especially good arguments). However, the entirety of this project was aimed towards challenging my fellow open-borders supporters to present their strongest case, and I felt the best way to do that was to present an actual antagonist to argue against.

What follows is a summary of the best arguments presented against LOTF’s main points. After that, I’ll add a few personal notes, as well as some thoughts about the ITT aspect.

  1. Assimilation effects are relatively large. Since the privilege of official political involvement is not automatic with immigration (nor does it have to be under open borders), by the time you are able to meaningfully influence politics, America will have largely changed and assimilated you. At least on average, America changes immigrants far more than immigrants change America.
  2. Additionally, even when they have the ability to vote or otherwise interact with the political process, immigrants as a group are not very involved.
  3. Founder effects, legacy institutions, and political structure all have much more influence on the politics of a nation than any single voting generation.
  4. Immigrants self-select for many traits very beneficial, and even under open borders, this effect would likely not vanish. Even with no institutional barriers to migration, migration is still difficult and those that choose to migrate often do so because they’re “voting with their feet” against the bad policies of their homeland.
  5. Lastly, even if immigrants were very heavily involved politically and voted in uniformly terrible ways, the American electorate is very elastic. Voter turnout is affected by many things, and one of those things could easily be great masses of immigrants voting in ways natives don’t like.

There is plenty of evidence to support those five positions – to start, look no further than the comments on “Betting the Republic!”

I would like to thank all of the commenters who engaged with me under my nom de plume; you made it an enjoyable and educational experience. I am filled with great confidence in the ability of the crew here to debate this topic well!
I would especially like to thank Vipul Naik, who was “in” on the whole charade, even planting a few strategic comments to challenge me further.

And I would like to apologize to Alexander Nowrasteh, who linked to “Betting the Republic” in a recent Cato blog post as an (as far as he knew, genuine) example of a political exernalities argument. The post, genuine or not, serves perfectly well in that role, so I hope he isn’t too upset at my ruse.

Now, lastly, I’d like to take a moment and talk about the actual Ideological Turing Test. I cannot rightly claim to have passed 100%. While none of the comments on “Betting the Republic” (or the other post responding to Bryan Caplan) indicated that anyone thought I wasn’t genuine (though several may have thought I was wrong or even foolish), the true test would have been if any restrictionists had supported me, rather than simply open-borders-advocates opposing me. If you imagine a typical Republican/Democrat debate, it would probably be far easier for a typical Republican to convince other Republicans that he was a Democrat than to convince actual Democrats that he was one of them. All our hypothetical Republican would have to do would be to play into the stereotypes his peers expected and they’d be unlikely to question his credentials – but other Democrats would more harshly judge someone who they thought wasn’t representing their views accurately.

In that sense, I did not necessarily pass the ITT. However, I would like to think that the group of people reading and commenting on “Betting the Republic” represents an above-average level of intellect and reason (to say the least). At least to some extent, convincing such a group that I was a restrictionist (a category of political viewpoint that this group in particular studies rather extensively) is enough to lead me to believe that I am accurately and charitably representing my opponents’ viewpoints. Since no restrictionists commented to support me, however, I can’t say for certain that I would be able to seamlessly pass as one of their own. So I’ll give myself a C+, but I can’t say I deserve an A.

However, this has been an enlightening and educational experience for me, and I want to sincerely thank everyone who participated. Now, answer in the comments: Did you think I was genuine (even if you didn’t think my argument was good)?

Forget not the temporary migrants

There are many different ways to think about migration; when we discuss the subject, often people’s vision seems to be of someone moving with intentions of permanently settling and acquiring citizenship in their new country. Occasionally, they might give some passing thought to explicitly temporary guest workers on the side. The popular “permanent migrant” characterisation might accurately describe a lot of people, but I am skeptical that it captures the full picture. Here are some other broadly-painted immigration stories that don’t often come to mind:

  • The tourist who falls in love with a country she visits. One day while browsing job postings, she finds and applies for a job in that country.
  • The student who decides to apply for a university abroad on a whim. He finds he enjoys life there, and seeks to work afterward there.
  • The manual labourer who decides to look for construction work in a country with a better economy than his own.

These people could all follow the typically-envisioned track, and stay permanently in their new country. But they could well not: perhaps the tourist finds life in her new country is not all it’s chalked up to be. She moves on to another country, or returns home. Maybe the student and manual labourer are happy to stay and work for years, or even a few decades, but later move home to take care of aging parents and raise a family.

Common discourse around migration tends to assume two paths. Either you are:

  1. A permanent migrant, and once your visa is approved, you are on a one-way path to citizenship
  2. A temporary migrant, and you should be a seasonal commuter (working in a foreign country for one or two seasons, returning home for the rest of the time)

(Less sophisticated discussions sometimes even forget the second category. More sophisticated ones might include in the second category guest workers whose seasonal commutes are a little longer, working for the span of a few years at a time.)

But this common discourse is incapable of fitting real human beings into its shoehorned categories. Realistically, new immigrants don’t know whether they want to commit to a new country, and if so, for how long they’ll want to make that commitment. Maybe they’ll commit to it for a career, but not for family. (Or maybe it’s the other way round: I know some people who have migrated primarily for family reasons, but maintain jobs or businesses in their home country.) Maybe you commit to one country for the harvest season, but not for the rest of the year. Maybe you commit to it for only as long as construction work is available, or only until you’ve saved enough to buy what you want at home.

You might consider these trivial or rare scenarios, but I would argue they’re more common than you think. I consider myself one of these amorphous immigrants: I am a Malaysian who is currently a permanent resident in the US, but I’m not sure how long I’ll live here. The range of possibilities for how long I live and work here in my opinion range from 5 years to 50 or more. They are contingent a great deal on my career path in the US, whether my significant other is allowed by the government to live and work in the US (she is also a Malaysian), the political and economic climate back home, and what opportunities I might find in other countries.

(Speaking of countries I’ve fallen in love with as a tourist, I’ve often thought it would be fun to work in London or in another Western European city. My girlfriend thinks it might be interesting to work in Hong Kong, where she studied for a few years. If we do migrate to one of these places, who’s to say whether we’ll live and work there for 1 year or 10? Or our lifetimes?)

If you prefer hard numbers, consider the polling data: over 1 billion people (over 25% of the world’s population) say they desire to temporarily move to another country in search of work. This is about double the number of people who say they desire to permanently move to another country. I find these numbers a bit dicey for two reasons:

  1. A lot of people might not even be bothered to think of moving, permanently or temporarily, when they know that our system of global apartheid makes it impossible for most people to live and work outside their country of birth — this would artificially depress these numbers.
  2. Some people might not be sure whether they want to move temporarily or permanently. If you ask me whether I am a temporary or permanent migrant, I would honestly answer that I don’t know.

But these numbers are definitely directional. If when you think of migration and when you think of open borders, you only think of permanent settlement, you’ve erased 2/3rds of all the people who would like to migrate. You’ve written off the hopes, dreams, and futures of over 1 billion people. Open borders is not just about the permanent settler. It’s about ensuring people with all kinds of goals and motivations can make the most of themselves and contribute as much as they can.

Eternal Vigilance: A Response to Professor Bryan Caplan

Open Borders note: With the exception of the link to Caplan’s post being responded to, all other links have been added by Open Borders staff to ease research, and not at the behest of the author.

Author’s Note: While my original agreement with the staff at Open Borders was to write a single blog post, a recent post from Professor Bryan Caplan at the Library of Economics and Liberty caught my eye as being directly relevant to our discussion. I still intend to honor my one-week agreement, but the Open Borders staff has generously allowed me to post a short response to Professor Caplan here.

In response to your post, Professor Caplan: There is a reason that immigration restriction is fundamentally different than the other faux “policies” you list in your post. That fundamental difference is that the freedom to teach and learn how you wish, reproduce as you wish, speak and vote how you wish are all liberties of a particular group, and restricting who enters that group is the only way to preserve those liberties in the long term.

I am not swayed by the concepts of “natural rights.” They are a fine moral construct for philosophical debates, but when it comes to the world in which we live, great individuals had to sacrifice tremendously to secure those liberties from those who would trample them, whether or not they’re your natural rights. The price of liberty is eternal vigilance. I am not so alarmist as to think that open borders today would lead to disaster tomorrow, or even ten years from now. But if I want my grandchildren to grow up in a nation where they have the freedom to speak, vote, reproduce, teach, learn, and live their lives as they wish, then the nation must be preserved.

If everyone in the world wanted freedom and liberty as badly as the early Americans did, then the whole world would now have governments very similar to America’s. That is not the case. People want prosperity, but the vast majority of people cannot identify the link between freedom and prosperity. They think America is wealthy because of the things they see: land, technology, etc. They don’t recognize that it is our freedom that makes us wealthy. And so they think they can come to America and enjoy all the prosperity, but also use all that wealth to create vaster and vaster government involvement until we are wealthy no more. I don’t think this will happen in ten or maybe even twenty years. But unless it is abated, I think it could happen in one hundred, or even fifty.

The most moral policy of any government is one that creates the most net freedom for its people. If a small freedom must be revoked so that a vastly greater freedom is preserved, then that policy is moral. The Founding Fathers understood this – they did not gain independence from Great Britain and then abolish all government in favor of anarchy. They created a limited government that must (as all governments must), by its very nature, infringe on liberty to some small degree. Their goal was to keep that degree as small as possible while still preserving the greater liberty. Minor restrictions on immigration are no different. I do not advocate closing the borders; I don’t even suggest a set quota. Rather, I suggest strict criteria, such that liberty is preserved.