
This post was originally posted on the blog Cato at Liberty and is reproduced here with the author’s permission.
A common criticism of immigration reform (here, here, and here) is that it will decrease economic freedom in the United States, by increasing the voting pool for the Democratic Party. Leaving aside the issue of which party supports economic liberty, if any, it’s important to see what the actual impacts of immigration are on economic freedom in the United States and the world. The political effects of immigrants after they arrive are less certain than the economic benefits. Do immigrants decrease economic freedom in their new countries? The bottom line: fears of immigrants decreasing economic freedom seem unfounded.
Since 1980, wealthy countries have seen rises in immigrant populations. Immigrants are drawn to economic prosperity, higher wages, and better standards of living so it’s not surprising that wealthier countries have higher percentages of immigrants. I excluded numerous small countries and petro-states like the UAE and Kuwait from the analysis.
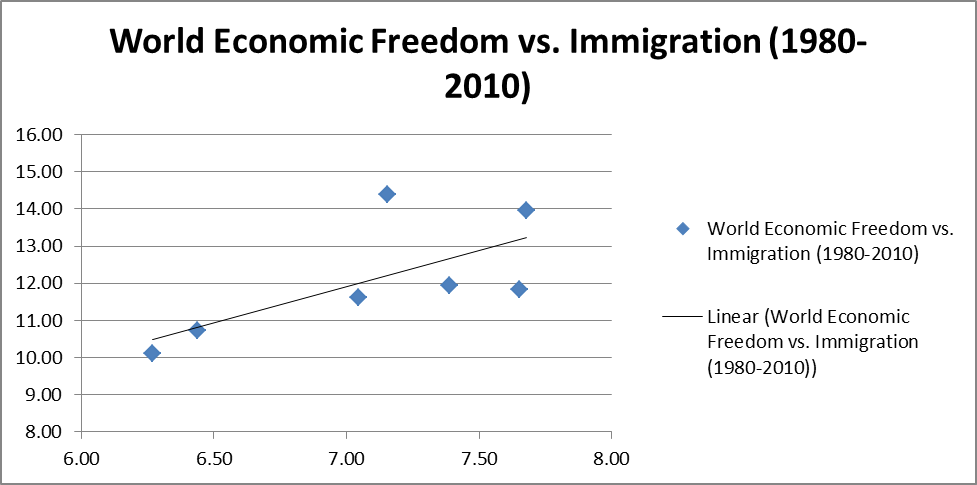
I looked at the 25 wealthiest nations in the world in 1980 (by per capita GDP PPP) and considered their economic freedom rating and the percent foreign born. I then tracked those same countries every 5 years until 2010. Here are the averages for all 25 nations:
|
World |
|||
|
Year |
Economic Freedom Rating |
GDP Per Capita (PPP) |
Immigrant (%) |
|
1980 |
6.27 |
$20,875 |
10.11 |
|
1985 |
6.44 |
$21,475 |
10.72 |
|
1990 |
7.05 |
$23,912 |
11.61 |
|
1995 |
7.39 |
$24,671 |
11.95 |
|
2000 |
7.65 |
$28,788 |
11.82 |
|
2005 |
7.68 |
$30,454 |
13.96 |
|
2010 |
7.15 |
$30,481 |
14.37 |
Sources: Economic Freedom of the World: 2012 Annual Report, World Bank Development Indicators
From 1980 to 2010, the average economic freedom rating for those 25 nations increased by .88 points and their foreign born populations increased by 4.27 percentage points, while per capita GDP increased by $9,606. The Great Recession makes those numbers appear less remarkable because of the decrease in economic freedom between 2005 and 2010 that accompanied the slowdown in growth.
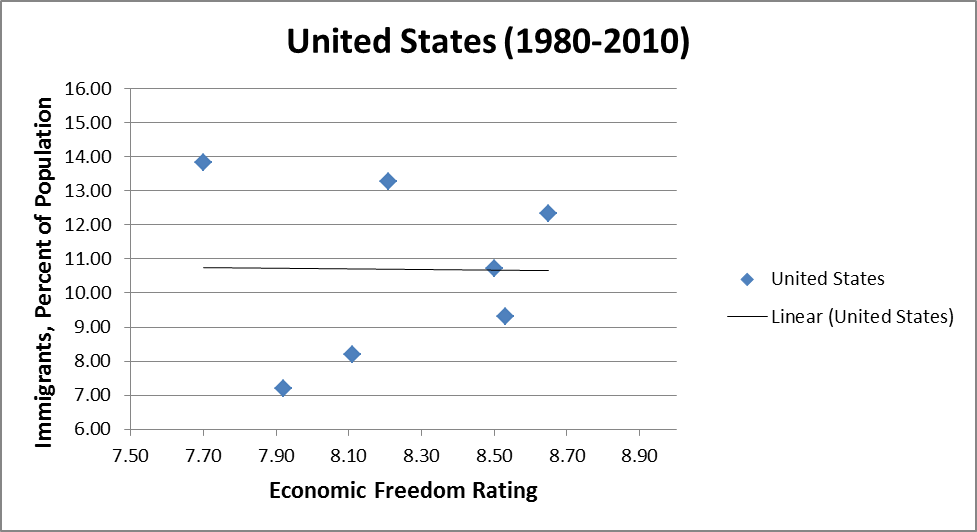
And when we zoom in on the United States:
|
United States |
|||
|
Year |
Economic Freedom Rating |
GDP Per Capita (PPP) |
Immigrant (%) |
|
1980 |
7.92 |
$25,510 |
7.20 |
|
1985 |
8.11 |
$28,562 |
8.19 |
|
1990 |
8.53 |
$31,899 |
9.31 |
|
1995 |
8.50 |
$33,874 |
10.71 |
|
2000 |
8.65 |
$39,545 |
12.34 |
|
2005 |
8.21 |
$42,516 |
13.29 |
|
2010 |
7.70 |
$42,079 |
13.84 |
Sources: Economic Freedom of the World: 2012 Annual Report, World Bank Development Indicators
From 1980-2010, the United States’ economic freedom rating fell by .22 and the foreign-born population increased by 6.64 percentage points. The entire loss in economic freedom occurred post 2005 while the foreign-born population rose by .55 of a percentage point, the smallest increase in any 5-year period. It seems highly unlikely that a .55 percentage point increase crossed a threshold that caused the economic freedom rating to decrease so much.
Remember that the claim made by many opponents of immigration reform is that more immigrants will cause a decrease in economic freedom. A linear regression (OLS) of the economic freedom rating and the percent of immigrants in the United States produced a coefficient of -0.0013908 with a t-value of -.02. The R-squared for that regression is 0.0001. That means that factors other than immigration explain 99.99 percent of the decrease in America’s economic freedom rating. On its face, the hypothesis that an increasing percentage of immigrants in the United States will decrease economic freedom does not hold much water.
Sources: Economic Freedom of the World: 2012 Annual Report, World Bank Development Indicators
Excluding small countries, here are the wealthiest nations in the world in 1980:
|
1980 |
||||
|
Richest Excluding Small Countries |
||||
|
GDP per capita, PPP |
Income | % Immigrant | EF Rating | |
|
1 |
Saudi Arabia |
33,903 |
19.60% |
– |
|
2 |
Switzerland |
29,363 |
16.90% |
7.99 |
|
3 |
Norway |
26,205 |
3.00% |
5.79 |
|
4 |
Bahamas |
26,045 |
11.40% |
6.26 |
|
5 |
United States |
25,510 |
7.20% |
7.92 |
|
6 |
Canada |
23,070 |
15.50% |
7.68 |
|
7 |
Netherlands |
22,271 |
3.50% |
7.23 |
|
8 |
Iceland |
21,847 |
2.50% |
5.25 |
|
9 |
Bahrain |
21,139 |
28.90% |
7.42 |
|
10 |
Belgium |
20,793 |
9.10% |
7.06 |
|
11 |
Denmark |
20,790 |
3.20% |
6.39 |
|
12 |
Austria |
20,714 |
9.50% |
6.33 |
|
13 |
Sweden |
20,362 |
7.50% |
5.68 |
|
14 |
France |
20,264 |
10.70% |
6.09 |
|
15 |
Australia |
19,784 |
19.70% |
6.86 |
|
16 |
Italy |
18,814 |
2.00% |
5.37 |
|
17 |
United Kingdom |
18,154 |
6.00% |
6.57 |
|
18 |
Finland |
17,858 |
0.80% |
6.65 |
|
19 |
Japan |
17,835 |
0.70% |
6.88 |
|
20 |
New Zealand |
17,391 |
15.10% |
6.35 |
|
21 |
Greece |
17,043 |
1.80% |
5.76 |
|
22 |
Gabon |
17,007 |
13.90% |
4.50 |
|
23 |
Spain |
15,368 |
1.60% |
6.10 |
|
24 |
Trinidad and Tobago |
15,310 |
5.70% |
4.83 |
|
25 |
Israel |
15,028 |
36.90% |
3.48 |
| Average |
20,875 |
10.11% |
6.27 |
|
Sources: World Bank, Cato Economic Freedom of the World Index.
In 1980, 9.4 percent of people living in all countries (including small ones like Monaco and the United Arab Emirates) were immigrants, compared to 10.1 percent in the richest countries. The average economic freedom rating in the world was 5.4 compared to 6.27 for the richest. In 1980, the 25 richest countries in the world had more immigrants and more economic freedom than the average nation.
|
2010 |
||||
|
Richest Excluding Small Countries |
||||
|
GDP per capita, PPP |
Income | % Immigrant | EF Rating | |
|
1 |
Norway |
46,906 |
10.00% |
7.53 |
|
2 |
United States |
42,079 |
13.50% |
7.70 |
|
3 |
Switzerland |
39,072 |
23.20% |
8.07 |
|
4 |
Netherlands |
36,925 |
10.50% |
7.58 |
|
5 |
Ireland |
35,993 |
19.60% |
7.92 |
|
6 |
Austria |
35,313 |
15.60% |
7.55 |
|
7 |
Canada |
35,223 |
21.30% |
8.09 |
|
8 |
Australia |
34,602 |
21.90% |
8.14 |
|
9 |
Sweden |
34,125 |
14.10% |
7.62 |
|
10 |
Germany |
33,565 |
13.10% |
7.53 |
|
11 |
Belgium |
32,882 |
9.10% |
7.47 |
|
12 |
United Kingdom |
32,814 |
10.40% |
7.87 |
|
13 |
Iceland |
32,779 |
11.30% |
7.02 |
|
14 |
Denmark |
32,379 |
8.80% |
7.76 |
|
15 |
Finland |
31,310 |
4.20% |
7.89 |
|
16 |
Japan |
30,965 |
1.70% |
7.61 |
|
17 |
Equatorial Guinea |
30,493 |
1.10% |
– |
|
18 |
France |
29,484 |
10.70% |
7.39 |
|
19 |
Italy |
27,083 |
7.40% |
6.73 |
|
20 |
Spain |
26,901 |
14.10% |
7.40 |
|
21 |
Korea |
26,774 |
1.10% |
7.20 |
|
22 |
Israel |
25,995 |
40.40% |
7.25 |
|
23 |
Slovenia |
25,053 |
8.10% |
6.62 |
|
24 |
Oman |
24,559 |
28.40% |
8.00 |
|
25 |
New Zealand |
24,400 |
22.00% |
8.38 |
| Average |
32,307 |
13.32% |
7.60 |
|
Sources: World Bank Development Indicators, Economic Freedom of the World: 2012 Annual Report.
In 2010, 11 percent of people living in all countries were immigrants. The average economic freedom rating in the world was 6.84, 1.44 points higher than in 1980. The 25 richest countries in 2010 had a greater percentage of immigrants and a higher economic freedom rating than the rest.
These results are not surprising. To the extent that economic freedom produces greater economic prosperity, immigration will likely increase. Given the results from the regression analysis, there is practically zero evidence that immigrants have caused a decline in economic freedom. Other factors, such as an increase in the regulated state, likely explain changes in economic freedom more than the intensity of immigration.
Opposing immigration reform for the reason that new immigrants will decrease economic freedom is a popular excuse in some circles – but there is surprisingly little evidence to support this myth. Moreover, merely pointing out that immigrants are more likely to vote for the Democratic Party is insufficient because actual policy shifts count more than partisan political outcomes. Those who claim immigrants will decrease economic freedom have yet to prove it.
Nowrathteh’s summation completely avoids reality as to mass immigration. It degrades and usurps jobs from the host nation’s native workers–especially minorities with scant education. He glosses over the fact that mass immigration overwhelms the environment, energy,water and resource base of the host country. In short: this stupid commentary cannot be understood with any credibility. No matter what your degree in college, you lack common sense and rational thinking. Endless immigration from third world countries that produce 80 million extra people annually cannot be sustained by first world countries–unless, of course, they want to become third world countries themselves. Get a grip man. Frosty Wooldridge, 6 continent world bicycle traveler
Hey Frosty! Just a quick note, Alex’s post is about one particular argument against open borders. If a single blog post could deal with every objection and every argument in favor of the idea we wouldn’t need a whole site for it. But for those curious about the points Frosty brings up I encourage you to scroll up and check out the potential harms sections of the site. Thanks for posting Frosty!
A fascinating result! This does provide some hard evidence against these fears, but I can see one significant objection. It may be the case that the tipping point in an effect such as this comes when a majority of the population is immigrants. I’m not personally convinced that’s the most plausible idea however. The United States for instance, managed to elect a second-generation black American (one on side of his family anyways) without non-whites losing their majority either in the population at large or in the voting booth. If there was going to be a significant immigrant-induced negative impact on economic freedom, I would have expected to see it in the data. At the very least, even if this isn’t a deathblow to the political externalities argument (and the related IQ arguments) this should at least weaken their appeal.
The data are from mostly selective migration regimes that pick out desirable immigrants, who are often on average bringing up the average human capital of the receiving countries.
http://perso.uclouvain.be/frederic.docquier/filePDF/DM_ozdenschiff.pdf
Table 3 lists the portion of workers who meet a skilled worker qualification with the portion of emigrants to OECD countries from that country or region who are skilled.
4.0% of Africans qualify, but 30.9% of African emigrants do. 6.3% of Asians qualify, but 46.8% of Asian emigrants do.
That level of selection is incompatible with open borders. If someone argues that immigration which lowers average human capital stock has some negative long-term effects in the recipient country, while human-capital-increasing immigration improves things, it’s a bait-and-switch to use the figures from the selective migration system to say they should think open borders would have similar effects.
The post is most relevant to people who think there is something about immigrants qua immigrants that impairs local institutions, instead of being concerned about human capital or other particular features of immigrants, which will vary depending on selection policies and other factors.
I guess you could refine the argument in this way:
Immigration does not have an effect on levels, but on changes.
This gives a good fit with an R^2 of 67,7%.
I think it would also be reasonable not to expect an immediate effect, but one with a lag of let’s say a decade (how long it takes for immigrants to become citizens). If I run it just on the overlap, R^2 goes up to 82,8%. In this case you could make a prediction that economic freedom will be at 6,86 in 2015 and at 6,02 in 2020, which looks pretty bad. And unfortunately, it could prove to be correct.
Now you could argue that low levels are still furthering economic liberty. But I could do a Krugman on you and claim that it would have improved even more without it, and improvements come from natives who counterbalance the bad influences of immigrants.
If someone tried to make such an argument, I’d not be impressed with a forecast on only five data points. In addition, making inferences from such aggregate data, you would have to guard against confounding variables. But that also applies to the original argument on only seven data points .
[BTW, I was a little astonished that Germany would not make it to the top 25 in 1980 – the Federal Republic, of course.]
For anyone wondering: I took immigration at the end of five years vs. change in those years. That’s debatable. If I take immigration at the beginning, I get a better R^2 for contemporaneous and a worse for lagged, but still high with 76% and 69%. Forecasts get worse with 6.9 in 2015 and 5.9 in 2020. But then it is now down to just four data points.
I am bit tired, so excuse any errors, but it looks like I can’t really mess this up.
Missing real romance? Get FastSyt and find it! http://www.fastsyt.com
What type of content would you like to see more of in the future? Let us know in the comments!
I shared my referral code with friends and earned coins – it’s a win-win. Experience the best way to connect and meet new people. Download Fastsyt for Android and start your journey now! Get it on. Google Play. Click here to join: https://play.google.com/store/apps/details?id=com.fastsyt.gomeet&hl=en_CA
I’ve been using this and the Mystery Date feature is amazing. Experience the best way to connect and meet new people. Download Fastsyt for Android and start your journey now! Get it on. Google Play. Click the link to see for yourself: https://play.google.com/store/apps/details?id=com.fastsyt.gomeet&hl=en_CA
Your blog has helped me through some tough times and I am forever grateful for your positive and uplifting content
Your positive and uplifting words are like a ray of sunshine on a cloudy day Thank you for spreading light and positivity in the world
Your posts always speak to me on a personal level and I believe that is a testament to your authenticity and genuine nature
Keep up the incredible work! I can’t wait to see what you write next.
As a new reader, I am blown away by the quality and depth of your content I am excited to explore your past posts and see what else you have to offer
I appreciate how this blog promotes self-growth and personal development It’s important to continuously strive to become the best version of ourselves
Deobet ile kazanmaya devam, şansımız bol olsun.
I am blown away by the depth and detail in your posts Keep up the excellent work and thank you for sharing your knowledge with us
The video call feature sends coins to the receiver – such a cool idea. Experience the best way to connect and meet new people. Download Fastsyt for Android and start your journey now! Get it on. Google Play. Tap here to get the app: https://play.google.com/store/apps/details?id=com.fastsyt.gomeet&hl=en_CA
Keep up the fantastic work!
This blog covers important and relevant topics that many are afraid to address Thank you for being a voice for the voiceless
I’ve been using this and the Mystery Date feature is amazing. Experience the best way to connect and meet new people. Download Fastsyt for Android and start your journey now! Get it on. Google Play. Click the link to see for yourself: https://play.google.com/store/apps/details?id=com.fastsyt.gomeet&hl=en_CA
Your posts always make me feel like I’m not alone in my struggles and insecurities Thank you for sharing your own experiences and making me feel understood
We just wanted to take a moment to acknowledge all the hard work and effort you’ve been putting in lately. Keep up the amazing job, you’re doing great!
Your blog has quickly become one of my favorites I am constantly impressed by the quality and depth of your content
Leave a comment and let us know what your favorite blog post has been so far!
Thank you for sharing your personal experience and wisdom with us Your words are so encouraging and uplifting
Kahramanmaraş Katliamının Perde Arkası
Your writing is so eloquent and persuasive You have a talent for getting your message across and inspiring meaningful change
We just wanted to take a moment to acknowledge all the hard work and effort you’ve been putting in lately. Keep up the amazing job, you’re doing great!
I have been following your blog for a while now and have to say I am always impressed by the quality and depth of your content Keep it up!
I love how this blog gives a voice to important social and political issues It’s important to use your platform for good, and you do that flawlessly
İsrailYönetimi
Your latest blog post was truly inspiring and had some great insights. I can’t wait to see what else you have in store.
Limanlar Bizimdir. Anayasa’dan Montrö’ye, Egemenlik Oyunu
Keep up the incredible work! I can’t wait to see what you write next.
Your blog is so much more than just a collection of posts It’s a community of like-minded individuals spreading optimism and kindness
Let’s spread the love! Tag a friend who would appreciate this post as much as you did.
I just wanted to take a moment to express my gratitude for the great content you consistently produce. It’s informative, interesting, and always keeps me coming back for more!
Your writing style is so engaging and easy to read It makes it a pleasure to read your blog and I always look forward to your new posts
Whether you want friendship or love, this app has you covered. **Experience the best way to connect and meet new people. Download Fastsyt for Android and start your journey now! Get it on. Google Play.** Install via this link: https://play.google.com/store/apps/details?id=com.fastsyt.gomeet&hl=en_CA
Your writing is so powerful and has the ability to make a real difference in people’s lives Keep using your voice to spread kindness and positivity
Yargıdaki Rüşvet Çarkı: Yüksel Kocaman Rüşvet Skandalı, İsmail Uçar’ın İtirafları, HSK’nın Koruma Duvarı ve Basın Ayağı İddiaları
Comparing manual sweeping to industrial litter vacuums is like comparing a typewriter to a laptop. The productivity gains with machines like the Aria 240 are simply massive.
This is exactly what I needed to read today Your words have given me a new perspective and renewed hope Thank you
Your writing is so powerful and has the ability to make a real difference in people’s lives Keep using your voice to spread kindness and positivity
Your writing is so powerful and has the ability to make a real difference in people’s lives Keep using your voice to spread kindness and positivity
Your writing is so powerful and has the ability to make a real difference in people’s lives Keep using your voice to spread kindness and positivity
Ready to find love faster and smarter? **Experience the best way to connect and meet new people. Download Fastsyt for Android and start your journey now! Get it on. Google Play.** Click the link to get started: https://play.google.com/store/apps/details?id=com.fastsyt.gomeet&hl=en_CA
This post came at just the right time for me Your words have provided me with much-needed motivation and inspiration Thank you
Your writing is so powerful and has the ability to make a real difference in people’s lives Keep using your voice to spread kindness and positivity
I appreciate how this blog promotes self-love and self-care It’s important to prioritize our well-being and your blog reminds me of that
Yargıdaki Rüşvet Çarkı: Yüksel Kocaman Rüşvet Skandalı, İsmail Uçar’ın İtirafları, HSK’nın Koruma Duvarı ve Basın Ayağı İddiaları
Here are the 30 messages with the numbers removed, each including the Google Play link and a call to action to click on it.
Chatham House’la İhanetin Dış Politikası Sahnesi
Looking for a social app that actually works? **Experience the best way to connect and meet new people. Download Fastsyt for Android and start your journey now! Get it on. Google Play.** Make sure to click the link to install: https://play.google.com/store/apps/details?id=com.fastsyt.gomeet&hl=en_CA
Great article. Wishing you continued growth and good business ahead. AutopartsMarketplace.lt is also a useful catalog for Mercedes-Benz parts and tuning.
İran, BAE’de bulunan bulut tohumlama tesisini vurdu. Aselsan Projeyi devir mi alıyor
This blog is not just about the content, but also the community it fosters I’ve connected with so many like-minded individuals here
Your vulnerability and honesty in your posts is truly admirable Thank you for being so open and authentic with your readers
Your blog is a constant source of wisdom and positivity Thank you for being a ray of light in a sometimes dark world
إيجي بست | EgyBest | مشاهدة أفلام ومسلسلات اون لاين Egy Best
This post is jam-packed with valuable information and I appreciate how well-organized and easy to follow it is Great job!
Acne Treatment That Actually Works | Struggled with acne for years until I found a treatment that really works. Here’s my honest, no-filter review of what helped clear my skin, reduce breakouts, and boost my confidence.
Thank you for the amazing blog post!
As a fellow blogger, I can appreciate the time and effort that goes into creating well-crafted posts You are doing an amazing job
Your writing is so engaging and easy to read It makes it a pleasure to visit your blog and learn from your insights and experiences
FETÖ/PDY’nin devlet sızma stratejisinin en klasik ve en sinsi yöntemi buydu. 2010 KPSS sorularının çalınması Ankara 2. Ağır Ceza Mahkemesi’nce kesin hükümle tescillendi; örgüt üyeleri sorulara önceden ulaşıp “altın nesil” diye pazarladıkları kişileri öğretmenlikten hakim-savcılığa kadar kritik kadrolara yerleştirmişti.
https://twitter.com/ozgur_dogan_y/status/2052729474718785618
Your writing is so eloquent and engaging You have a gift for connecting with your readers and making us feel understood
Your blog has become my go-to source for inspiration and motivation Thank you for consistently delivering high-quality content
This blog covers important and relevant topics that many are afraid to address Thank you for being a voice for the voiceless
magic kingdom mushroom chocolate
Your posts always seem to lift my spirits and remind me of all the good in the world Thank you for being a beacon of positivity
Your passion for what you do is evident in every post It’s inspiring to see someone truly fulfilling their purpose and making a positive impact
https://wonkachocolatebars.com/shop-2/wonka-thc-gummies/
I appreciate your creativity and the effort you put into every post. Keep up the great work!
Your positive energy and enthusiasm radiate through your writing It’s obvious that you are truly passionate about what you do
Bu, Düzen ile Düzülenin oyunu!
I am truly thankful to the owner of this web site who has shared this fantastic piece of writing at at this place.
Your passion for what you do shines through in every post It’s truly inspiring to see someone doing what they love and excelling at it
Share with us in the comments your favorite blog posts of all time!
What other topics would you like to see covered on the blog? Let us know in the comments!
I very delighted to find this internet site on bing, just what I was searching for as well saved to fav
Taking orders while I sleep has completely changed my business revenue. Highly recommend this for any shop owner! https://webilaa.com/
Your posts are so well-written and engaging You have a way with words that keeps me coming back for more
AKP’li Başkan Tek Bir Demeci ile 6 Anayasa Maddesini Çiğnedi.
This blog is a great resource for anyone looking to live a more mindful and intentional life Thank you for providing valuable advice and tips
Nice post. I learn something totally new and challenging on websites
Keep up the fantastic work!
Your blog has quickly become one of my favorites I am constantly impressed by the quality and depth of your content
Thank you for creating such valuable content. Your hard work and dedication are appreciated by so many.
I like the efforts you have put in this, regards for all the great content.
Thank you for the amazing blog post!
I love how this blog covers a variety of topics, making it appeal to a diverse audience There is something for everyone here!
I am so grateful for the community that this blog has created It’s a place where I feel encouraged and supported
Your blog has become my go-to source for inspiration and motivation I am so grateful for the valuable content you provide
This is exactly what I needed to read today Your words have provided me with much-needed reassurance and comfort
This is such an important and often overlooked topic Thank you for bringing attention to it and offering valuable advice
From the insightful commentary to the captivating writing, every word of this post is top-notch. Kudos to the author for producing such fantastic content.
If you are planning a trekking adventure in Nepal and wish to explore the breathtaking Nepal Trekking, I highly recommend choosing Nature Trail Treks & Travel Company for an exceptional experience. Their expertise and personalized service ensure a memorable and safe journey through the Himalayas — visit us today! – https://www.naturetrail.com
Laser facial treatment restores confidence and reveals beautiful, clear skin free from blemishes.
It’s always a joy to stumble upon content that genuinely makes an impact and leaves you feeling inspired. Keep up the great work!
Your writing has a way of making me feel like I’m having a conversation with a close friend It’s so genuine and relatable
This blog is not just about the content, but also the community it fosters I’ve connected with so many like-minded individuals here
Your latest blog post was truly inspiring and had some great insights. I can’t wait to see what else you have in store.
A good source for getting started with the topic.
Your content always manages to captivate and educate me. Keep up the fantastic work!
I admire how this blog promotes kindness and compassion towards ourselves and others We could all use a little more of that in our lives
It’s clear that you have a deep understanding of this topic and your insights and perspective are invaluable Thank you for sharing your knowledge with us
Your blog has become my go-to source for inspiration and motivation I am so grateful for the valuable content you provide
As a fellow blogger, I can appreciate the time and effort that goes into creating well-crafted posts You are doing an amazing job
Your blog is a haven of positivity and encouragement It’s a reminder to always look on the bright side and choose happiness
Your posts are always so well-written and thought out It’s evident that you put a lot of effort into each and every one
This post was exactly what I needed to read today Your words have provided me with much-needed clarity and reassurance
Join Notisboard and start offering paid sessions directly from your phone.
Here are updated Facebook post captions for [Notisboard](https://notisboard.com/?utm_source=chatgpt.com) focused on “how to earn online in 2026”, “how to make money from home”, and expert growth themes.
The creator economy is growing fast in 2026.
✔ Consultations
Your latest blog post was truly inspiring and had some great insights. I can’t wait to see what else you have in store.
Your blog is a place I come to when I need a boost of positivity It’s like a warm hug from a friend Thank you for being that friend
I love how this blog promotes a healthy and balanced lifestyle It’s a great reminder to take care of our bodies and minds
✔ Consultants
—
Avukat Hüseyin Cimşit ile 1989’dan bugüne uzanan hukuki mücadeleyi konuşacağız.
As a fellow blogger, I can appreciate the time and effort that goes into creating well-crafted posts You are doing an amazing job
Your knowledge and expertise on various topics never ceases to amaze me I always learn something new with each post
Many are monetizing their knowledge, communication skills, and expertise online through platforms like Notisboard.
🌍 [https://notisboard.com/](https://notisboard.com/)
• Technology Advice
Your honesty and vulnerability in sharing your personal experiences is truly admirable It takes courage to open up and I applaud you for it
As a fellow blogger, I can appreciate the time and effort that goes into creating well-crafted posts You are doing an amazing job
From the bottom of my heart, thank you for being a source of positivity and light in this sometimes dark and overwhelming world
Your blog is a haven of positivity and encouragement It’s a reminder to always look on the bright side and choose happiness
I have been following your blog for a while now and have to say I am always impressed by the quality and depth of your content Keep it up!
For those seeking a memorable trekking adventure in Nepal, Nature Trail Treks & Travel Company is an excellent choice. Partner with Nature Trail Treks & Travel Company for expert guidance, quality service, and an authentic Himalayan experience. – https://www.naturetrail.com
Your passion for what you do is evident in every post It’s inspiring to see someone truly fulfilling their purpose and making a positive impact
Laser facial treatment restores confidence and reveals beautiful, clear skin free from blemishes.
Roblox Gift Cards help enhance your gameplay.
I admire how this blog promotes kindness and compassion towards ourselves and others We could all use a little more of that in our lives
Your posts are so well-written and engaging You have a way with words that keeps me coming back for more
• Real Estate
I just wanted to take a moment to say how much I appreciate your blog posts. They’re always well-written, informative, and keep me coming back for more. Keep up the great work!
Your posts are so beautifully written and always leave me feeling inspired and empowered Thank you for using your talents to make a positive impact
Your latest blog post was truly inspiring and had some great insights. I can’t wait to see what else you have in store.
Πολύ κατατοπιστικό άρθρο. Το instaboost.gr προσφέρει λύσεις για followers αγορά
I couldn’t stop scrolling and reading, your content is truly one-of-a-kind. Thank you for all the time and effort you put into creating such amazing content.
Are you planning to trekking in nepal and you should visit Nepal for Trekking. I would like to suggest to go with Nature Trail Treks and Travel Company. please visit – https://www.naturetrail.com
Planning a trek in Nepal? Nature Trail Treks & Travel Company offers stunning Himalayan scenery, rich culture, and an unforgettable experience. For a well-organized and hassle-free journey, I recommend Nature Trail Treks & Travel Company – https://www.naturetrail.com
🍎 [https://apps.apple.com/ca/app/notisboard/id6763775810](https://apps.apple.com/ca/app/notisboard/id6763775810)
—
👥 Group Sessions
🍎 iPhone: [https://apps.apple.com/ca/app/notisboard/id6763775810](https://apps.apple.com/ca/app/notisboard/id6763775810)
Notisboard helps experts earn through: