
I would like to explain an effect that I think is responsible for a lot of misconceptions regarding immigration. If I am right, my explanation shows that some common explanations, while not being entirely false, are mostly irrelevant, or at least of second-order importance. And this also means that conclusions based on such explanations, are off the mark. Explanations that naively extrapolate trends can be especially misleading.
Let me start with an example of what I mean. In 1961, the Federal Republic of Germany and Turkey struck a deal that Turkish “guest workers” (Gastarbeiter) could be hired by German businesses. There were similar treaties also with other countries such as Italy (1955), Greece (1960), or Yugoslavia (1968). 1961 was the year the GDR built the Berlin wall, so rather suddenly the influx of East Germans came to a halt (about 200,000 in 1960). The West German economy was running at full speed with 8.2% annual GDP growth in the 1950s. German businesses were desperately trying to hire additional workers as unemployment fell to below 1%.
So from 1961 to 1971, about 650,000 Turkish guest workers were hired, and until 1976, this grew to about 825,000. What happened in the meantime was that on November 23, 1973, the German government (Social Democrats & Free Democrats) decided to suspend the treaties with Turkey and other countries (except Italy) after a sharp economic downturn and rising unemployment. So no more workers could be hired. In addition, guest workers in Germany were given a choice either to return home or stay permanently. Family reunion was still possible. Only about 135,000 of the 825,000 Turkish guest workers in 1976 were women. Assuming that 135,000 of the male guest workers were married to them and the others would bring in an additional 535,000 women via family reunion, the total would amount to 1.4 million adult immigrants of Turkish descent. Since a return home was encouraged via payments, you would have to subtract a certain number of returnees, though.
And here is what baffles a lot of people: numbers kept going up after 1973. There are now (as per 2013), 2.8 million people of Turkish descent in Germany, roughly a doubling or even more if you assume there was some return migration. Most of the increase came long after 1973, e.g. there were only 2.1 million people with Turkish citizenship in 1998 (that’s when naturalization became rather easy, so up until this point Turkish citizenship usually meant someone was an immigrant or descended from one).
Here are some of the usual suspects to explain the rise: diaspora dynamics, chain migration via family reunion, men marrying women from Turkey and bringing them in, very high birth rates, maybe encouraged by generous welfare benefits, etc. While there is certainly anecdotal evidence for most of this, and also data supporting some of the claims, I think this all is at best a sideshow, and so further conclusions built on such explanations are mostly irrelevant. If I am right, there is nothing baffling about the observation at all, and the explanation is actually rather simple. It is only that a naive analysis tends to overlook the effect I will explain now.
I will work with stylized facts, but the results should not be materially different if you calibrate the model with exact data. Let’s assume that in one year 1 million people immigrate. For the moment let’s also suppose they are 50/50 men and women. To make things more transparent, I assume for the moment that immigrants are 0 years old (of course, that is false, but I will show later how to fix this).
What happens to the initial immigrants over time? Here’s a stylized graph for the percentages over time:
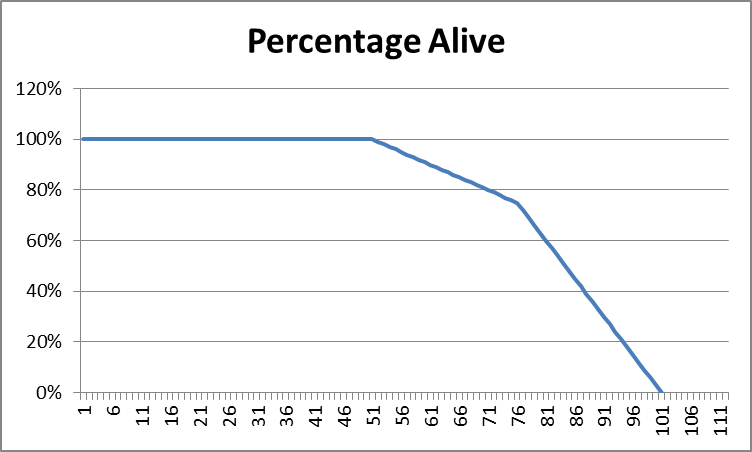
So, no one dies until age 51. Then 1% die per year until age 76 (i.e. a quarter), and 3% per year until age 101 (the rest). This is not entirely true as a certain fraction actually die already before 51, and the real graph is certainly not piecewise linear. However, it is not far off, and life expectation comes out slightly above 80 years which is quite close to reality. I also make the simplifying assumption that men and women have the same mortality. This is not true either, but again not too far off.
How about children? Again I make a simplifying assumption which is roughly in line with reality. The following percentages will have a child at the age on the x-axis (lumping men and women together, so per person, not woman):
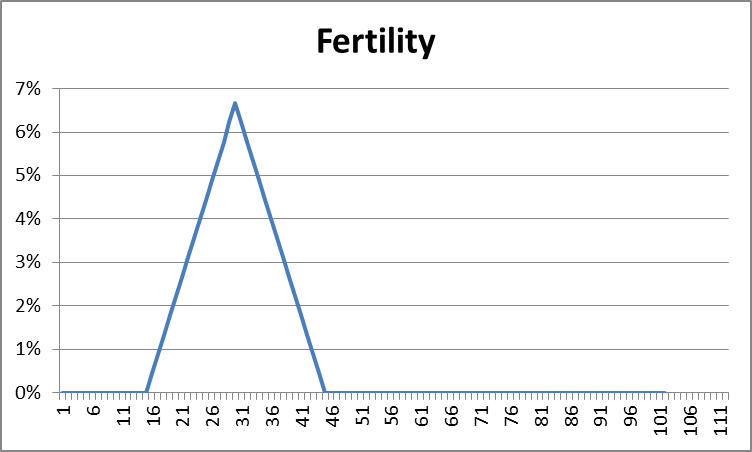
The peak is at 30 years, positive rates are from ages 16 to 44. The percentages add up to 100%, i.e. everyone (men and women) has exactly one child or two children per woman. Since no one dies in the relevant age groups (by assumption above), this means you have exactly replacement fertility (that’s why I adjusted reality a little to get confusing effects out of the way). To stress the point: there is no growth that I have built into the model. As you will see, no fancy birth rates are needed.
What happens to the one million initial immigrants in year 0? Since I assumed they are 0 years old, they won’t have any children right away, but starting after 15 years they will. And after some more time, their children will have children, etc. So the immigrant population (including descendents) will develop like this (millions):
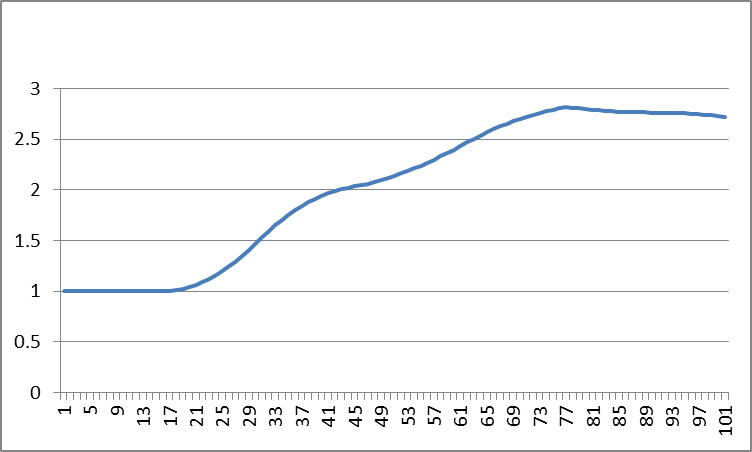
Don’t be fooled by the slight downward trend at about 100 years. There is some oscillation, but the number the line converges to is about 2.76. So over time, the one million will grow to 2.76 million. Children and grandchildren come on top. However, initial immigrants eventually die out, so great-grandchildren and further generations only make a minor difference, and the whole population settles into a steady-state. All in all you have almost a tripling, and that’s although I assumed replacement fertility, i.e. no growth at all!
Let’s fix the one unrealistic assumption. Of course, immigrants do not come at age 0. They come perhaps at age 20 (or 30 if you prefer this). But that’s very easy to fix. Just start at 20 (or 30) in the above graph instead of 0. There may be some children that were born before immigration. Add them in under the heading of family reunion which increases the size of initial immigration some. For immigration at age 20, this means that the factor will be slightly less than 2.76. If you take immigration at age 30 instead, then this will boost initial immigration by about 50%, so the factor is somewhat below 2. Note: 2 was about the factor we had for immigrants from Turkey to Germany (2.8 million people of Turkish descent now versus about 1.4 million initial immigrants, but maybe also some return migration). And I did not need any assumptions about massive further family reunion, brides from Turkey, gigantic birth rates, etc.
Here are some conclusions that are easy to read from the graph. Let me assume that immigrants come at age 20 (i.e. the graph starts at year 20). If you like some other age, adapations do not change the conclusions materially which are stylized anyway:
- Since there was only immigration in year 0 (i.e. 20 in the above graph), if the government decides to shut down immigration after that, then numbers will keep rising for over 50 years. Restrictionists will be stark staring mad because they are looking for loopholes as an explanation. There should also be calls for even stricter enforcement like a clamp-down on family reunions (although that is not possible by assumption).
- Over one generation (by construction on average 30 years), numbers will double. So this seems like a population with an extraordinary growth rate of 2.4% per year (for a doubling). If a population in steady-state (!) were to grow at such rate, it would mean a fertility of 4 per woman (by construction it is exactly 2 per woman). In the first years the increase is even steeper, more like 3% which corresponds to a fertility of about 5 in steady-state. So restrictionists will be looking for the huge families and come up with cultural explanations. And that would even apply here, where it is false by assumption. Higher fertility would not be unimportant, but compared to an additional perceived fertility of 2 or even 3 via the effect it will be second-order for a moderate divergence in fertility.
- After one generation, and even two generations, restrictionists may simply extrapolate the trend and conclude how the immigrant population will grow indefinitely and swamp everybody else. However, again by construction, there is no growth, and things will level off eventually. So the extrapolation is totally unwarranted.
- After about 50 years, the baffling thing might be that numbers stagnate (as is the case for people of Turkish descent in Germany by now). So there will be amazement over how that could happen.
- And one final conclusion that restrictionists usually miss (maybe if they did not, they would have to be very dishonest about the other claims): If you let in one million in the beginning, you will have 2.76 million descendents eventually. Not only the initial immigrants come, but their whole part in the population pyramid at home. (There is a twist that I will explore in a further post: this also means that all those people are missing in the source country.) So if restrictionists understood the effect, they could scale everything up by a factor of 2.76 (or whatever it is exactly calibrating with actual data) and make their stories even scarier.
Just as an extra service, here are the headlines in Germany for the next decades:
- 2015/2016: There are 1 million Syrian refugees to Germany.
- 2017: We can’t handle so many people and will close the borders for Syrians. (I am optimistic this will not happen wholesale, but then I want to stay true to the above example.)
- 2037: How could that happen? We let in just 1 million and clamped down on further immigration, now there are 2 million people here of Syrian descent! Are they smuggling more people in? A reporter has noticed a Syrian family with 10 children. It’s probably their culture. Let’s try to clamp down even more on migration from Syria.
- 2057: Now there are more than 2.5 million people of Syrian descent. Soon everybody will be Syrian here. What went wrong?
- 2067: Strange, they always had those extremely large families. Are they now migrating back to Syria?
—
Some further remarks
- The basic effect is known as “population momentum,” i.e. population growth has a certain inertia. Even if fertility changes (goes up or down), it takes some time before population growth changes to a new level (higher or lower). You can understand the effect in the following way: if you have a population with no growth, but 1% extra children in one year. Then this is equivalent to 1% immigrants at age zero. So you have the above build-up. There will be another 1% after one generation, and another 1% after two generations (minus some initial “immigrants” who have died in the meantime), and then it levels off.
- The effect that I describe is not just population momentum. My main point is about how population momentum is easily misinterpreted in the context of immigration. If you have an extra 1% children in one year, and it builds up to 2.76% extra population over time, anyone who looked at the development would speak of about 1% population growth per generation, which is not very impressive. The reference point here is the whole population. If the extra 1% population are immigrants, however, one may be inclined to take a different reference point: initial immigrants. So the same development would be described as a growth of about 100% per generation, which is much more dramatic. While the two cases are parallel, the perception is quite different.
- There is an extra effect that makes the perception even more dramatic. Since immigrants do not immigrate at age 0, but 20, 25, or 30, the first generation appears shortened. It does not take about 30 years for a doubling, but only 5 or 10 years. This adds even more drama. Especially, if someone does a sloppy analysis by comparing data for only two data points (which journalists or the general population are maybe prone to do).